

Interactive UI & diagnostics
The CLI ships with a full-screen terminal UI for browsing your workspace, plus a one-shot environment check. Both are useful the moment you installmcp.
mcp ui — the terminal dashboard
mcp ui opens an interactive dashboard over your orgs, servers, skills, deployments,
the marketplace, and local mcp dev sessions — no flags required.
--no-splash to skip it):
mcp ui splash — shown once per install.
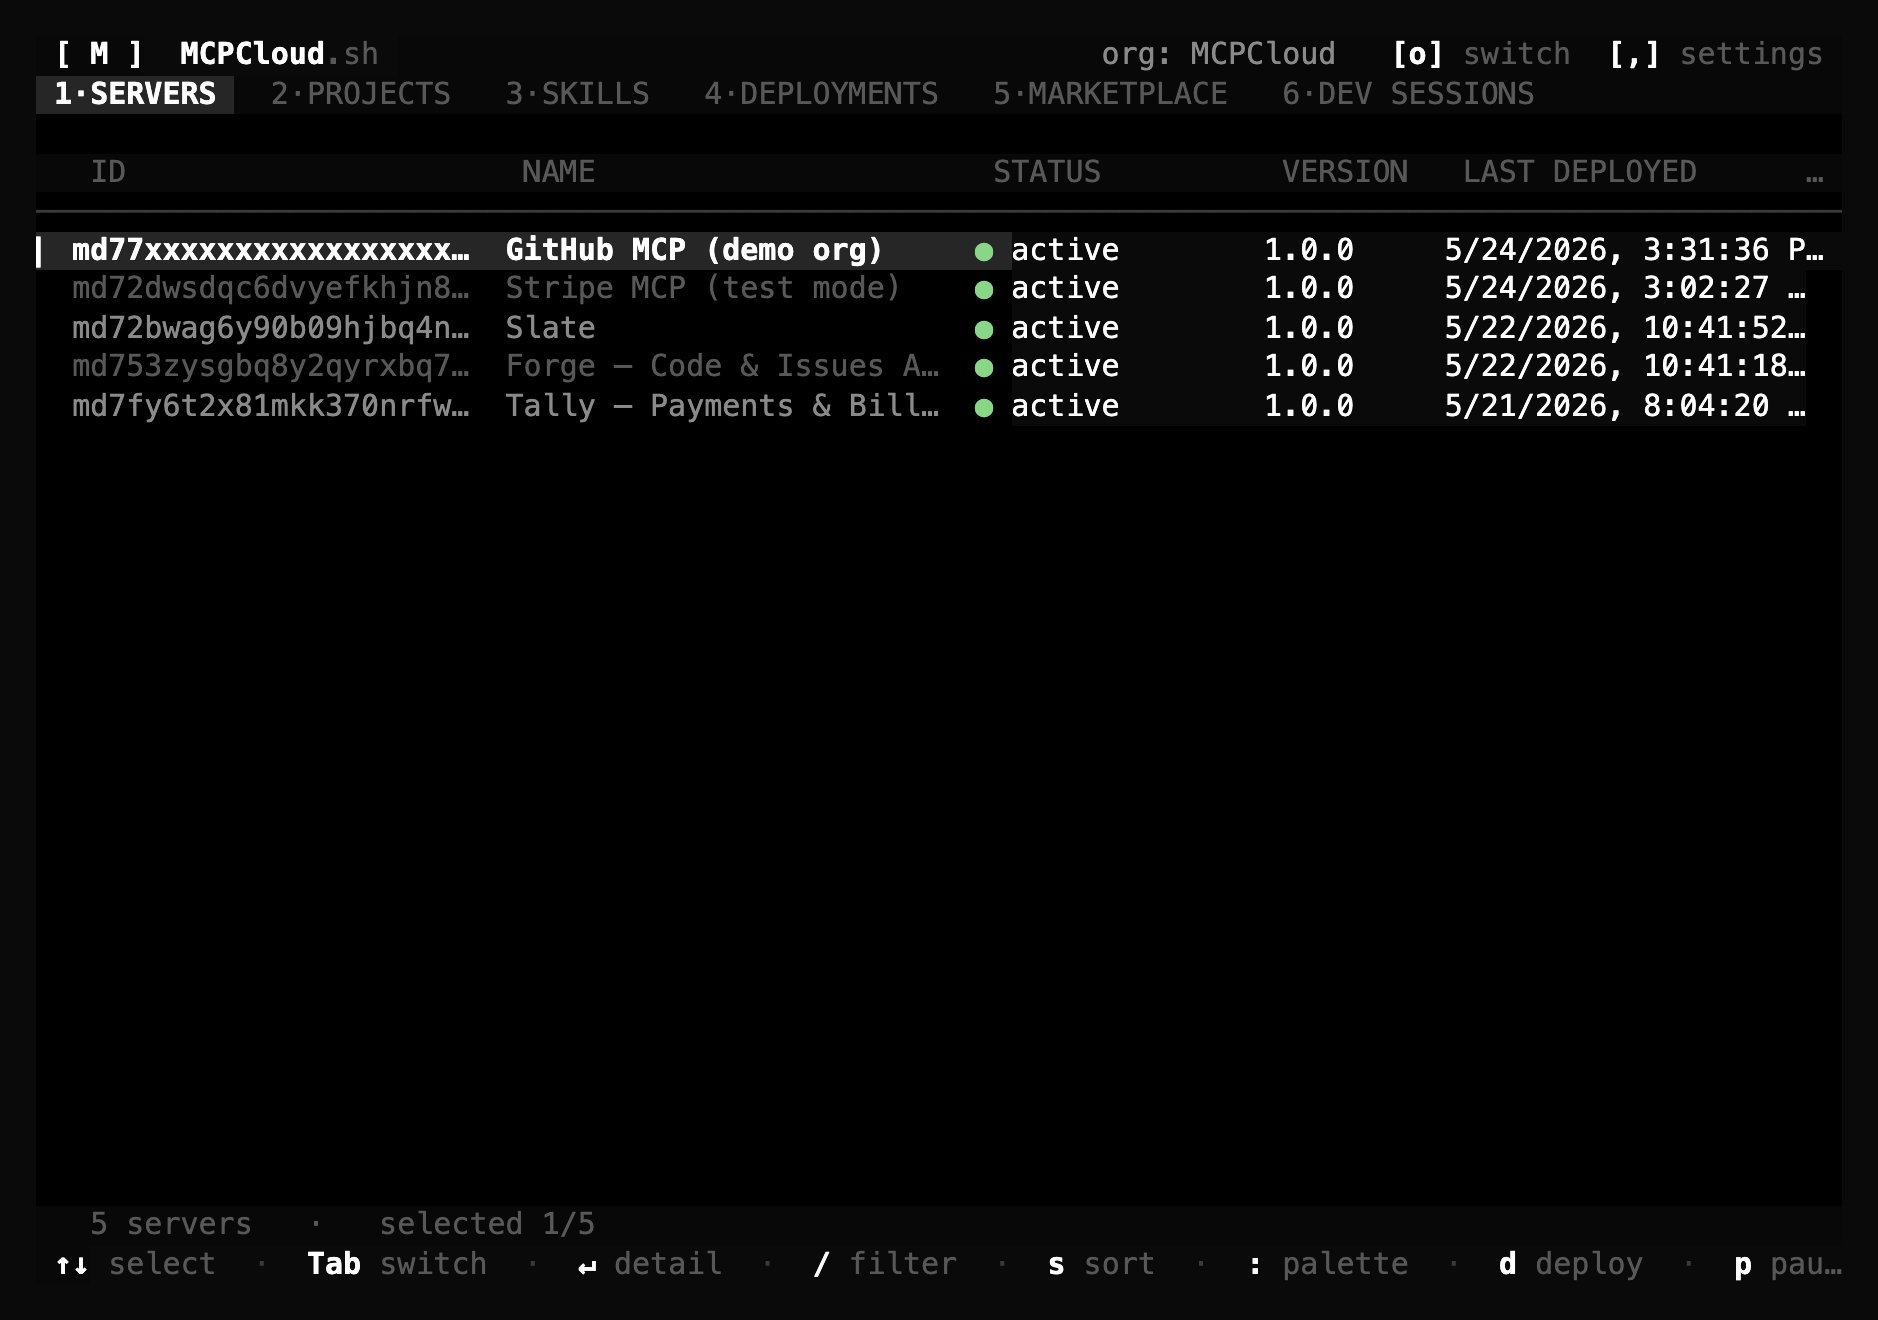
The Servers tab: live status, version, and last-deployed time for every server.
Tabs
Switch tabs with the number keys orTab:
Keys
Your last tab, org, sort, filter, and selected row are persisted to
~/.mcpcloud/tui-state.json, so the next launch resumes where you left off.mcp doctor — environment check
mcp doctor verifies your local setup in one pass: Node version, config file
permissions, the active profile and base URL, API-key authentication, the claude
CLI (used by mcp skills connect --apply), and whether you’re on the latest release.
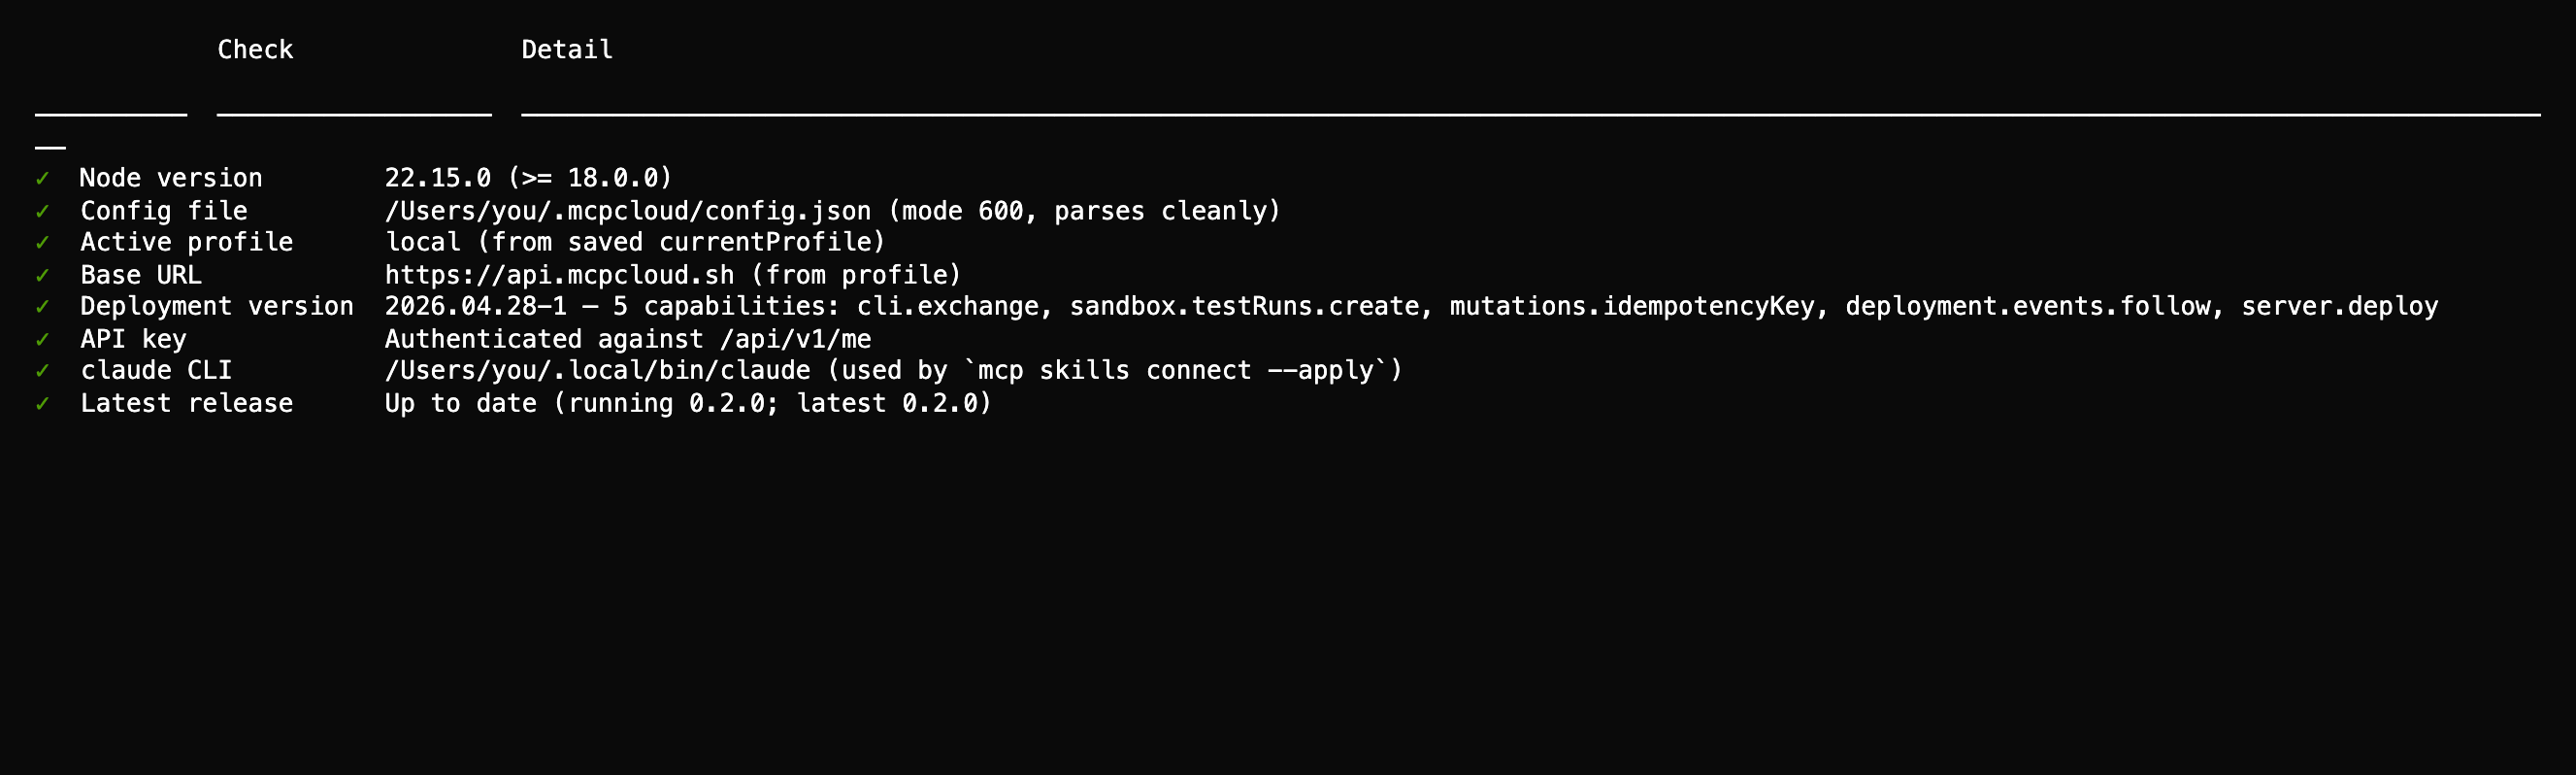
A healthy environment — every check passes.
cli.exchange, sandbox.testRuns.create, mutations.idempotencyKey,
deployment.events.follow, server.deploy) so you can confirm a command is available
before scripting against it. Pair it with mcp update to upgrade when a newer release
ships.